
“We want to determine how much ice is being lost at Arctic glacier fronts through calving and melting,” explains Dr. Thorsten Seehaus, describing his team’s research objectives. “Using remote sensing data, we analyse how glacier termini that extend into the ocean change over time. Combined with glacier flow velocities, this allows us to calculate the mass of ice that either flows into the ocean or breaks off.” Together with colleagues from the Chair of Pattern Recognition, Seehaus and his team at the Institute of Geography at Friedrich-Alexander-Universität Erlangen-Nürnberg (FAU) investigate frontal ablation, the melting and calving occurring at the seaward fronts of Arctic glaciers. Oceanography and climatology require this information for more accurate climate projections, while cryosphere science, the study of Earth’s frozen water, uses it to improve its models.
Using the approximately 150 glaciers of Svalbard (Spitzbergen), a Norwegian archipelago in the North Atlantic at the gateway to the Arctic Ocean, Seehaus and his team are developing and optimising measurement, mapping, and computational tools. To accomplish this, they rely on the data resources and infrastructure of terrabyte, the high-performance Earth observation data analysis platform operated jointly by the German Aerospace Center (Deutsches Luft- und Raumfahrtzentrum, short DLR) and the Leibniz Supercomputing Centre (LRZ). Through terrabyte, researchers can access, among other datasets, Synthetic Aperture Radar (SAR) imagery from the European Space Agency (ESA). These data originate from the Sentinel-1 mission, in which satellites scan Earth’s surface using electromagnetic waves to generate detailed two-dimensional representations of terrain features.
For the first time, the FAU research group processed satellite imagery covering complete years, spanning the period from 2015 to 2024. This amounted to a total of 7,069 images covering the entire region, representing more than 23 terabytes of image data. From these datasets, glacier-front subsets were extracted. “The Sentinel data provide near-daily coverage of the Svalbard region,” explains Seehaus. “We aggregate these observations to a monthly timescale. The higher temporal density helps us filter out mapping errors while preserving meaningful glacier-front changes.” Detailed information on frontal ablation remains scarce. Existing studies typically focus on individual regions or use coarse time intervals spanning several years.
Although the DLR calibrates and georeferences SAR imagery and prepares it for scientific use, the Erlangen research team also developed its own processing methods. “We use our own AI algorithms for both the pre-processing and post-processing of the imagery, as well as for glacier-front mapping,” says Seehaus. “This enables an efficient analysis of Sentinel-1 data on terrabyte.” To analyse the satellite imagery, the researchers implemented their own multi-temporal deep learning model, Tyrion-T-GRU, significantly reducing the effort previously required for the manual mapping of 203,294 glacier-front positions. The model processes eight consecutive satellite images simultaneously. By explicitly capturing changes at glacier fronts over periods of several months, it delivers substantially more accurate results than methods based on individual images. Using this approach, more than 15,000 calving fronts across Svalbard were identified and their temporal evolution documented.
Tyrion-T-GRU combines an ImageNet-pretrained SwinV2 encoder with a convolutional decoder composed of ResBlocks and UpsampleBlocks. Standard skip connections link the encoder and decoder.Temporal information is incorporated through bidirectional Gated Recurrent Units (GRUs) inserted into the encoder after a SwinBlock at each of the three lowest levels. In the decoder, temporal modeling is performed on the corresponding levels using one-dimensional temporal convolutions placed after the respective ResBlocks.
The model processes time series consisting of eight SAR images, each measuring 512 × 512 pixels, and generates a segmentation map of the same size for every time step. It follows a multi-temporal strategy that preserves temporal resolution throughout the entire sequence. Of the resulting 512 × 512 pixel predictions, only the central 256 × 256 pixel region is retained to ensure sufficient spatial context and improve prediction quality.
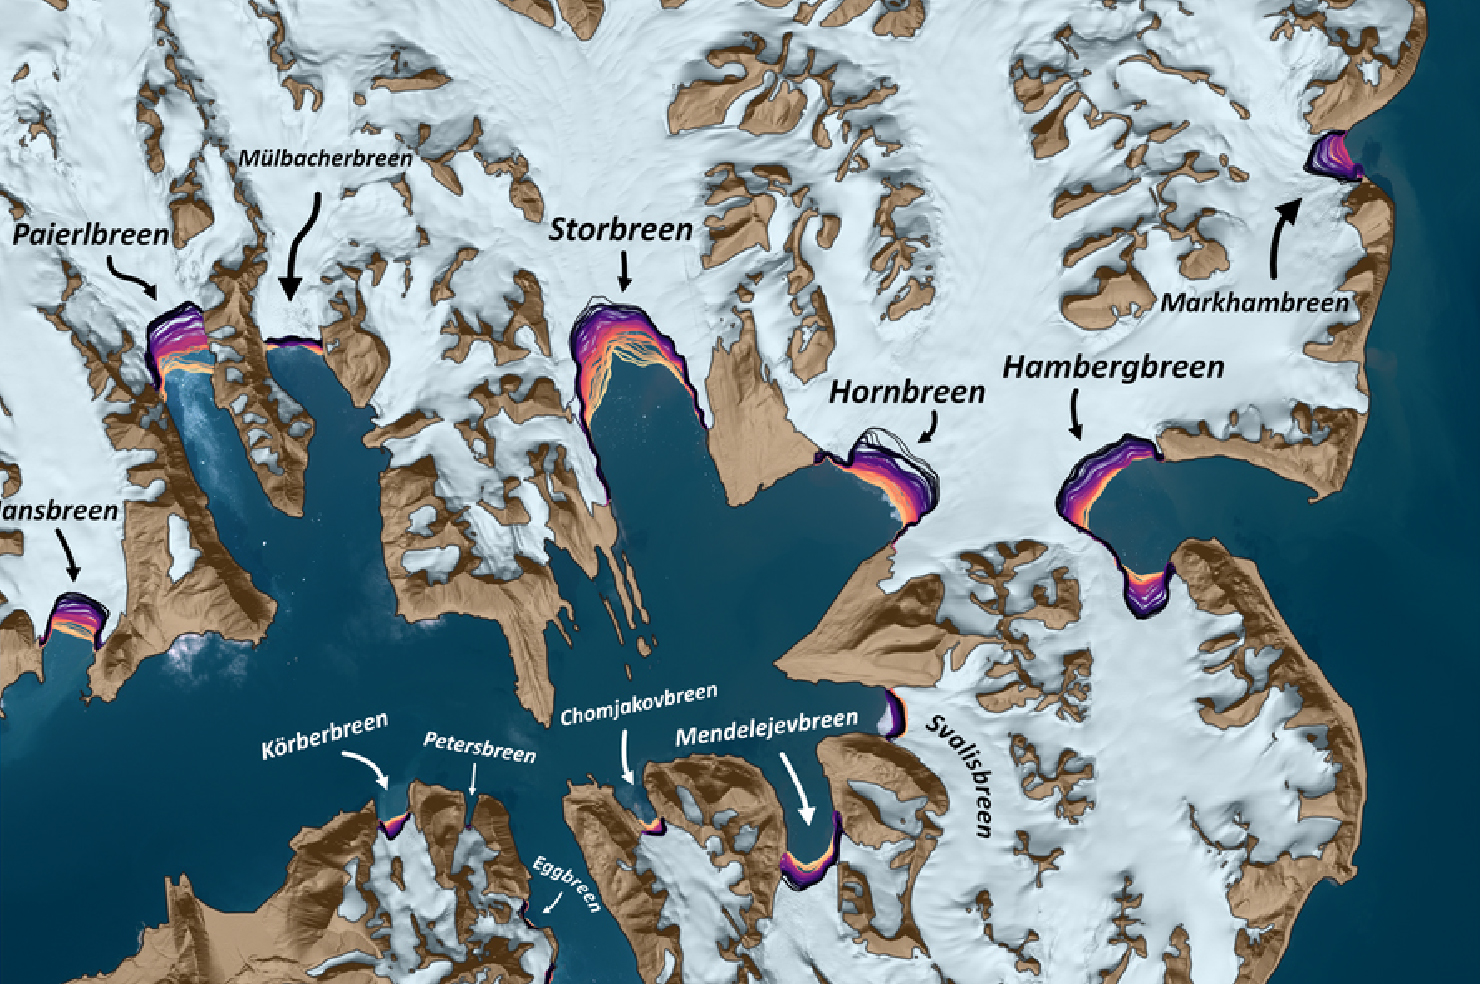
One outcome of this work is a set of detailed maps of the archipelago showing glacier fronts in fjords with high precision. Additional lines indicate how these fronts have shifted over the past decade. During winter, when sea ice often forms around Svalbard, glacier fronts generally advance, whereas they retreat during the summer months. A major finding of the long-term analysis is that frontal ablation has increased compared with earlier studies, a trend researchers attribute to climate change and global warming. “For every calving front examined, we can now estimate how much ice was lost from month to month,” reports Seehaus. “Information on frontal ablation is essential for calibrating existing glacier models. Studies have shown that neglecting this process can lead to uncertainties of up to 20 percent in ice-mass modeling.” As a result, simulations and predictive models become less accurate, affecting the reliability of future projections.
The benefits of these findings extend beyond cryosphere science. By combining their results with NASA datasets on ice discharge and ice thickness, the FAU team also estimated how much freshwater enters the northern oceans through glacier melting and calving. These data are relevant not only to glaciologists but also to oceanographers and meteorologists. “As increasing amounts of freshwater enter the ocean, salinity levels in different water layers change,” says Seehaus. “Around Svalbard this contribution is relatively small, but it is much more pronounced in Greenland.” Changes in salinity influence ocean circulation patterns and, consequently, the climate. According to the Potsdam Institute for Climate Impact Research (PIK), freshwater input weakens the Atlantic Meridional Overturning Circulation (AMOC), a system of ocean currents that transports warm, salty surface waters from the tropics northward while carrying cold deep waters southward. The AMOC plays a key role in maintaining the comparatively mild climate of Western and Northern Europe. For this reason, the Erlangen research team plans to extend its study to the entire Arctic using terrabyte. “On terrabyte, both the archive data and the processing infrastructure are available in one place,” explains Seehaus. “There is no need to move or duplicate large volumes of data, and we can take advantage of substantial computational power. This makes the process highly efficient." vs | LRZ
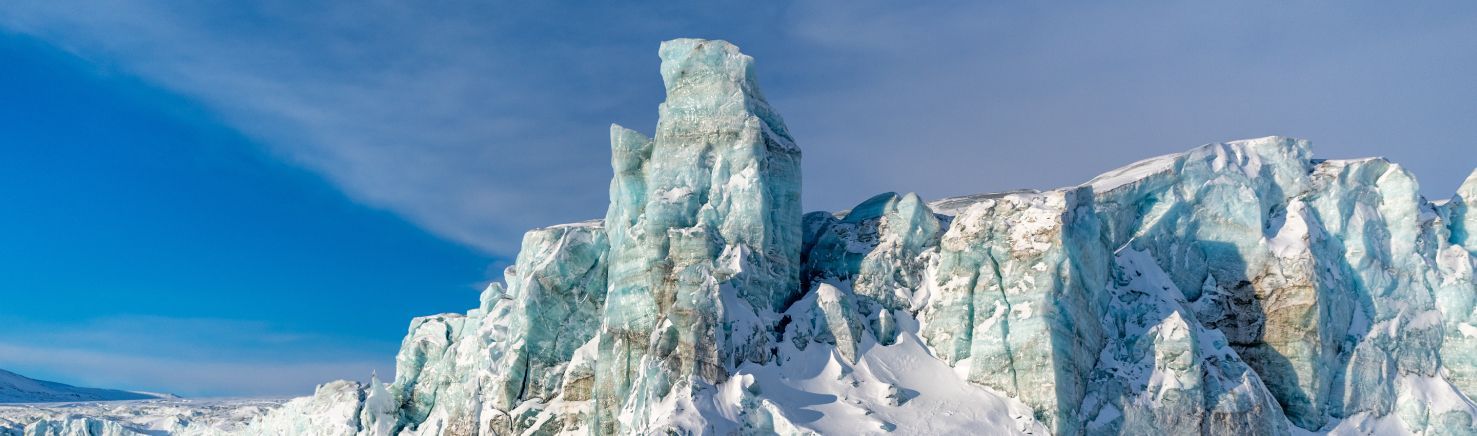
Header image: Glacier in Svalbard. Photo: Adobe.