PerSyst Report
User documentation on how to generate dynamic PerSyst Reports via web interface or/and via console command
Table of contents
General
 The PerSyst Report shows aggregated performance information about your submitted jobs on the Fat and Thin nodes of SuperMUC. The report is based on the PerSyst Tool which collects performance properties of all running jobs every 10 minutes. No instrumentation is needed nor modifications to the user codes.
The report includes a timeline view (screenshot) with the severity distribution over the affected CPUs (or other domains such as nodes) and a data/performance view (screenshot) with comparison graphs between properties. The user friendly interfaces to access this information are the web API (dynamic report) and the console command line tool (static report).
Note that you can only view your jobs and not other users' jobs on both types of accesses.
Dynamic Report
The web API shows the performance properties dynamically of executed jobs and currently running jobs. It is available via: https://www.webapps.lrz.de/ (menue item PERSYSTREPORT [ Phase 1, Phase 2]) and it is accessible with a valid LRZ SuperMUC user account (LDAP-SIM; VPN is not required). Refer to the DEMO for a detailed explanation on how to use the GUI. The Demos are working without an account. For more information about the different output views of the web API of PerSyst pease go to the explanation of the output of static report or click on Average View, Timeline View, and Data/Performance View. On each page of the web tool a Tour button is available to get an explanation on how the GUI works.
Static Report
The static persyst report is a command line tool at SuperMUC (login nodes). The report is viewable with any modern browser (For example: Firefox or Internet Explorer) . Check for reasons why there is no report for a particular job.
Usage
persystreport <command line options>
The command produces a zip file including a readme file and folders with html plus java script files. After unzipping the result file, and if you haven't specified the node type (=batch domain) and your search criteria yielded jobs in both node types you will see two folders for 'thin' and 'fat', otherwise just one of them. To see the report open the index.html in the (sub) folder with a web browser.
Called with option -h, persystreport will print the help information to the console.
Overview of command line options:
To get this help information (options explanations):
-h
To specify a time interval you can specify begin time and end time of the jobs which were submitted during this time:
    -b <yyyy-mm-dd hh:mm:ss>
    -e <yyyy-mm-dd hh:mm:ss>
To specify the minimum number of cpus assigned. Defaults to zero.
-m <min no of cpus>
e.g. if you want to see all your jobs with at least 128 cores:
persystreport -m 128
To specify a job or more than one job
-j <jobid> or -j <jobid_1>,<jobid_2>,<jobid_3>
To specific node type (=batch domain), 'thin' (=SuperMUC) or 'fat' (=SuperMIG), looks in both if not set. For example, jobs which were executed only on the thin nodes:
-n thin
To write to a specified file. The file default is report.zip.
-f <file>
Example of usage:
persystreport -b '2014-01-20 13:30:00' -e '2014-01-20 14:30:00' -j srv04-ib.7875346,srv04-ib.7875347 -f myFile.zip
Static Report - Output
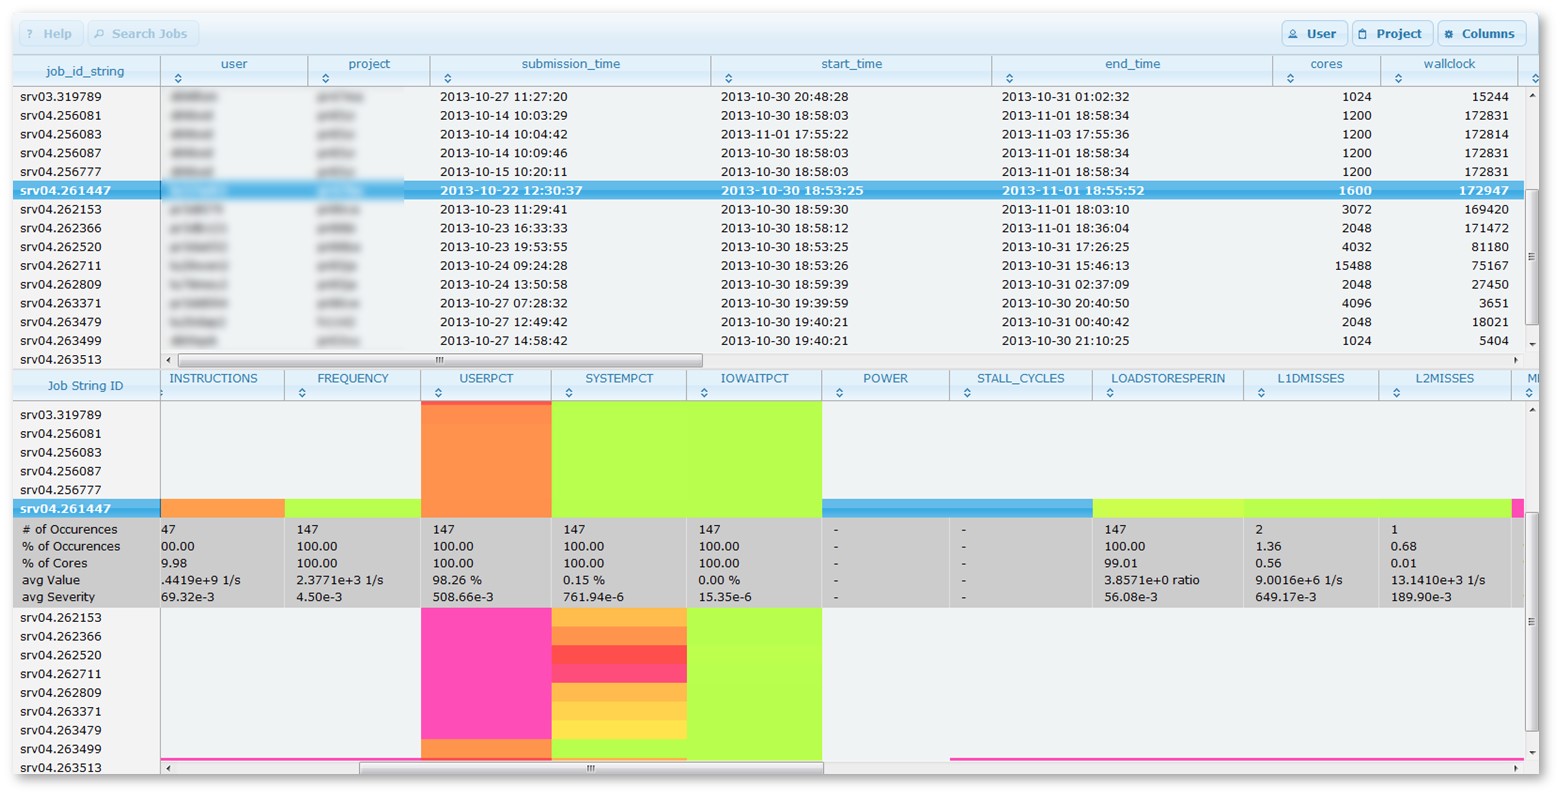
Job/Performance Average View
This view includes two sub views (screenshot), in the top the Job Overview/Accounting view and in the bottom the Performance Average view:
Job Overview (Accounting)
Initially, a list of jobs (accounting information) is shown in the top of the Job/Performance Average view which matches the parameters passed to the tool that generates this report. The buttons on the upper right give information about the user and the project details.
- The table is sortable by clicking the column headers. Columns can be shown/hidden using the dropdown menu to the upper right.
- Double clicking a row switches to the timeline view for the corresponding job.
Performance Average
The underpart of the Job/Performance Average Views shows the occurrence counts and average values of the properties for a certain job. Description of the rows from top to down:
- property: The property with the severity colour coding.
- # of Occurrences: How often a certain property was measured.
- % of Occurrences: How often a certain property was measured relative to the number of measurements of the reference property (property with maximal measurements/occurrence over time).
- % of Cores: How often cores were affected relative to the number of cores assigned to a job in percent. The formula is: 100*SUM(a1 ... an)/(t*c) where a is the number of cores which were measured at one timestamp, n the number of measurements of the property, t the number of cores assigned to the whole job and c the number of measurements of the reference property.
- avg Value: The arithmetic average of the average values of a certain property in engineering notation.
- avg Severity: arithmetic average of the average severities of a certain property.´
For each job id (row) in the first column of this view, the follow columns show the grant average severity of each property (over time and over cores). Every measurement is represented by a colored rectangle, ranging from green (severity is 0) to purple-red (severity is 1).
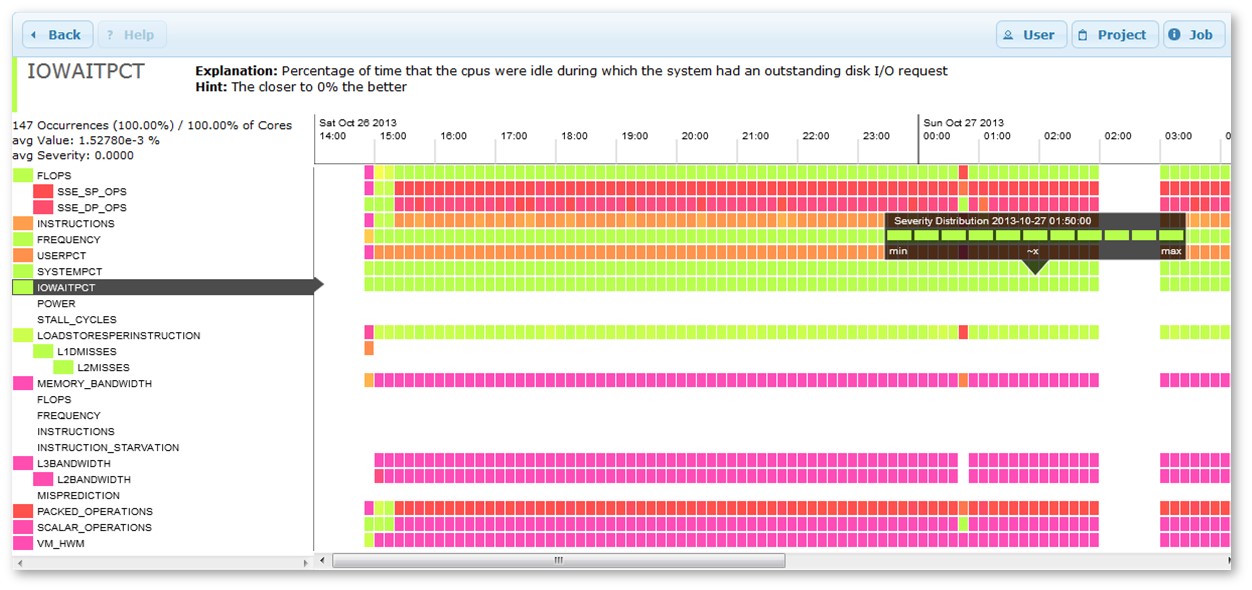
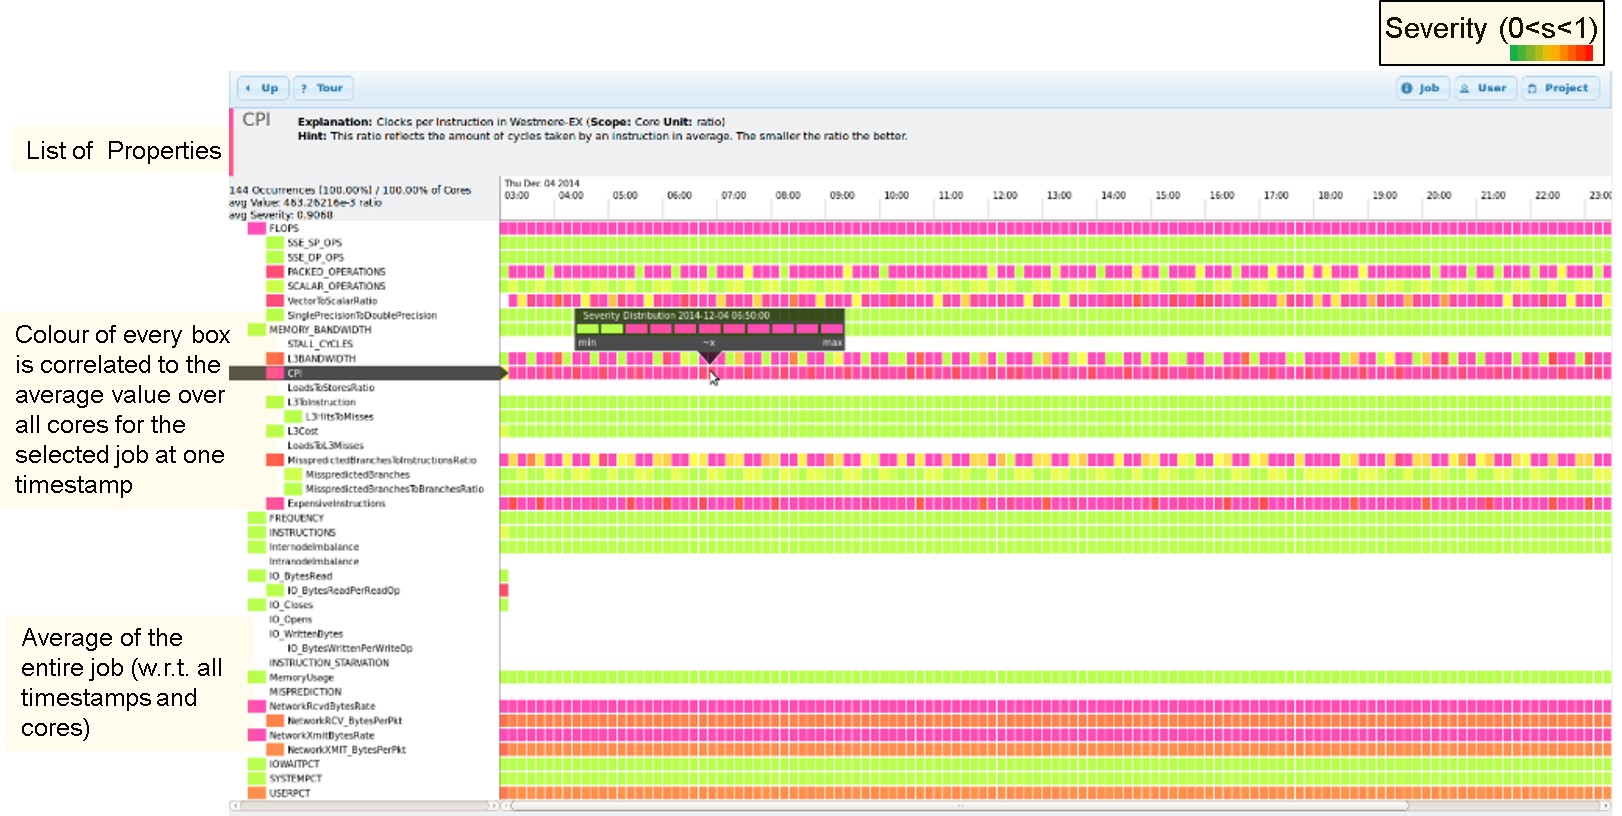
Timeline View
This view (screenshot) shows the average severity of each property over time. Every measurement is represented by a colored rectangle, ranging from green (severity is 0) to purple-red (severity is 1). White indicates that either PerSyst Monitoring didn't measure the property, or the measurement for this timestamp is missing completely.
The list to the left shows all active properties and their hierarchy, even if some of them may have never been measured for the job. The color tag left to a property's name represents the average severity while also taking into account how often it appeared. The formula is SUM(a1 ... an)/c where a is the average severity at one timestamp, n the number of measurements of the property and c the number of measurements of the reference property (property with maximal number of measurements/occurrences over time)
- Clicking a line or a property name selects the corresponding property.
- An explanation as well as a hint for the selected property are shown above the timeline, details appear beneath on the left side, for example:
122 Occurrences (42.95%) / 1.03% of Cores
avg Value: 411.61809e+0 1/cycles
avg Severity: 0.1472
Where the first line shows:
- The number of measurements (122)
- The percentage of measurements (42,95%) relative to the number of measurements of the reference property (property with maximal measurements/occurrences over time)
- The percentage of affected cores. The formula is: 100*SUM(a1 ... an)/(t*c) where a is the number of cores which were measured at one timestamp, n the number of measurements of the property, t the number of cores assigned to the whole job and c the number of measurements of the reference property
The second and third line show the arithmetic average of the average values/severities.
- Hovering with the mouse along the timeline brings up a little overlay window which shows the distribution of the severities for the selected Property at a certain point in time.
- Clicking the Up button in the top left corner switches back to the job list view.
- Double clicking a line switches to the data view.
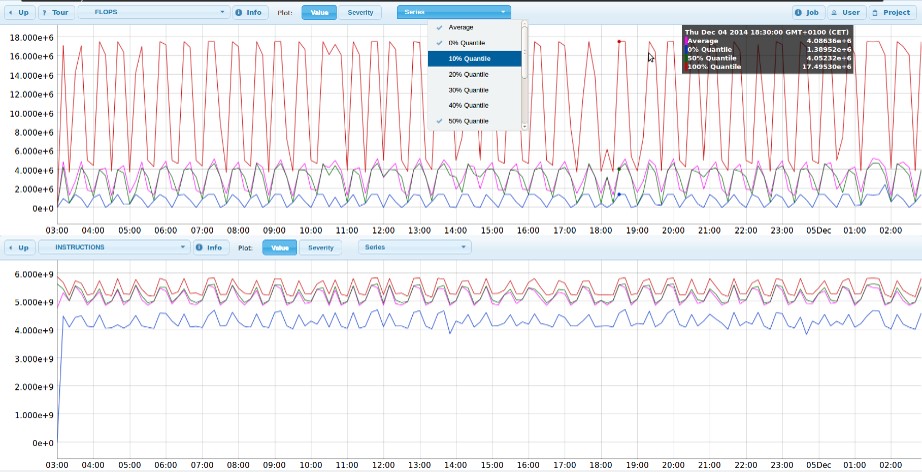
Data/Performance View
The Performance view (screenshot) is split horizontally to allow the comparison of the value/severity distribution between two properties of the selected job. Each part shows a plot of values and/or severities for the currently selected property and a table of the plotted data. The property for the upper part is set to the one selected in the timeline view by default.
- The series dropdown menu allows the selection/deselection of all plottable data series. The first two options are shortcuts for the average, minimum, median and maximum series for the Values or Severities of the current property.
- Mouse behaviour within the plot:
-
- Hovering shows the corresponding values in an overlay window
- Dragging horizontally zooms the x-axis
- Dragging vertically zooms the y-axis
- Double clicking resets zoom state of the plot
- The selector above the plot changes the currently displayed property. Greyed out options indicate missing data for the property.
- The table contains the raw data for the selected property. Dashes indicate that the property was not measured at a certain time. Contrary to the timeline view, missing measurements are not interpolated.
- Clicking the Up button in the top left corner switches back to the timeline view.
Browser Compatibility
The browser must support the HTML 5 canvas tag, and allow loading data from local files via XMLHTTPRequests.
In Feb '11 this applies to: Firefox 3.6, Safari 5, IE 9 RC.
The static report works with Chrome 9 if launched with the --allow-file-access-from-files switch.
Jobs which aren't monitored
Please note that some jobs will not appear in neither the basic nor the detailed report because:
- Measurements are carried out every 10 minutes beginning every day at 00:00:00. Jobs which are running less than 10 minutes might not be captured by our monitoring tool.
- In some rare occasions the monitoring tool is switched off for all SuperMUC or some of its node in order to carry out special performance measurements.
- Jobs were submitted before 2013-07-08.
![]()